
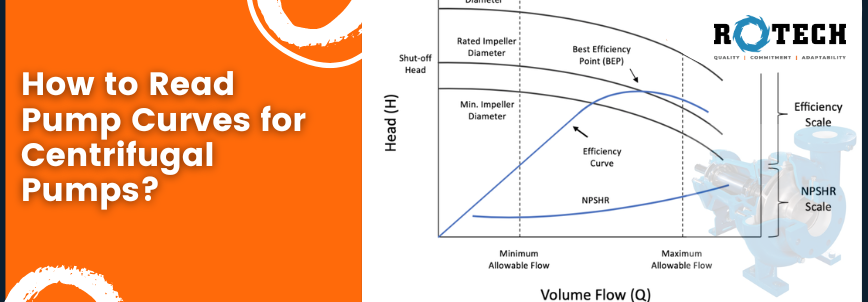
Centrifugal pumps are widely used in various industries, from water supply to chemical processing. A pump curve is a graphical representation of a centrifugal pump’s performance characteristics, which includes flow rate, head, and power consumption. Understanding pump curves is essential in selecting the right pump for an application and optimizing its performance. In this article, we will discuss how to read pump curves for centrifugal pumps and how to use them to choose the right pump for your application.
What is a Pump Curve?
A pump curve is a graphical representation of a centrifugal pump‘s performance characteristics. It shows the relationship between the flow rate (Q), head (H), and power consumption (P) of a pump at different operating points. The pump curve is generated by testing the pump in a laboratory and plotting the data on a graph.
Flow Rate and Head
The flow rate and head are the two primary parameters that define a pump’s performance. Flow rate is the volume of fluid that the pump can deliver per unit time, typically expressed in gallons per minute (gpm) or liters per minute (lpm). Head is the height to which the pump can lift the fluid, typically measured in feet or meters. The pump’s head is directly proportional to its impeller’s rotational speed and diameter.
Pump Curve Components
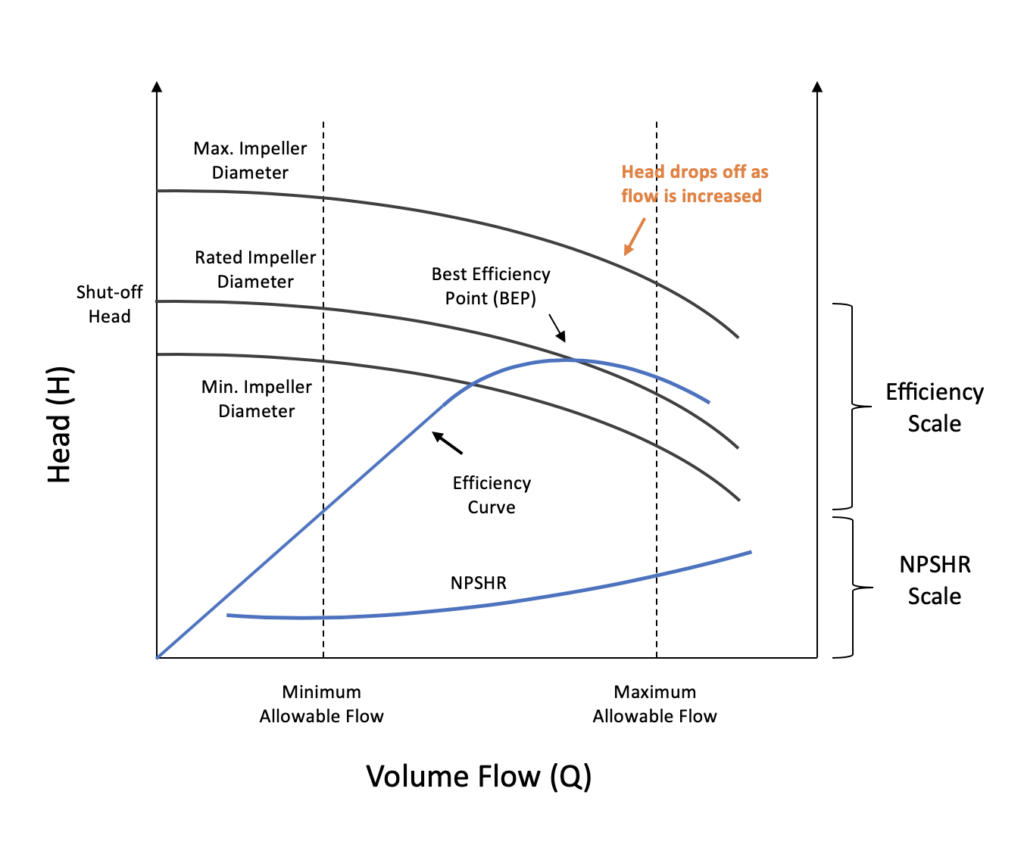
A typical pump curve consists of the following components:
Head-Flow Curve (H-Q Curve)
The head-flow curve (H-Q curve) shows the relationship between the pump’s head and flow rate at a constant rotational speed. The H-Q curve is typically plotted with head on the y-axis and flow rate on the x-axis. The curve shows that as the flow rate increases, the head decreases due to fluid friction and turbulence.
Power Curve (P-Q Curve)
The power curve (P-Q curve) shows the relationship between the pump’s power consumption and flow rate at a constant rotational speed. The P-Q curve is typically plotted with power consumption on the y-axis and flow rate on the x-axis. The curve shows that as the flow rate increases, the power consumption increases due to increased fluid friction and turbulence.
Efficiency Curve (E-Q Curve)
The efficiency curve (E-Q curve) shows the relationship between the pump’s efficiency and flow rate at a constant rotational speed. The efficiency curve is typically plotted with efficiency on the y-axis and flow rate on the x-axis. The curve shows that as the flow rate increases, the efficiency decreases due to increased fluid friction and turbulence.
Pump Curve Interpretation
Interpreting the pump curve is essential in selecting the right pump for an application and optimizing its performance. Here are some key points to keep in mind when interpreting the pump curve:
Best Efficiency Point (BEP)
The Best Efficiency Point (BEP) is the point on the H-Q curve where the pump operates at maximum efficiency. The BEP is the most economical operating point and should be targeted when selecting the pump.
Operating Range
The operating range is the range of flow rates and heads over which the pump can operate without damaging the impeller or motor. The operating range is limited by the pump’s minimum and maximum flow rates and heads.
Identify the shut-off head and the maximum flow rate of the pump.
The shut-off head is the maximum head that the pump can generate at zero flow. It is the point where the pump curve intersects the vertical axis of the graph. The maximum flow rate is the maximum flow rate that the pump can deliver at zero head. It is the point where the pump curve intersects the horizontal axis of the graph.
Understand the pump’s efficiency at different flow rates.
The efficiency of the pump varies with the flow rate. The efficiency curve is usually represented on the pump curve graph as a line or a curve. The efficiency curve shows the pump’s efficiency at different flow rates. The efficiency of the pump is usually highest at the BEP and decreases as the flow rate increases or decreases from the BEP.
Net Positive Suction Head (NPSH)
The Net Positive Suction Head (NPSH) is the difference between the fluid’s pressure at the pump suction and the vapor pressure of the fluid. The NPSH is a critical parameter in selecting the pump and should be greater than the pump’s NPSH requirement to prevent cavitation.
Interpreting Pump Curve Shapes
Different pump curve shapes indicate different pump characteristics. The following are the most common pump curve shapes:
Steep Curve
A steep curve indicates that the pump can produce high head at low flow rates. This type of pump is suitable for applications that require high pressure.
Flat Curve
A flat curve indicates that the pump can produce high flow rates at low heads. This type of pump is suitable for applications that require high flow rates.
Steep Drop-Off Curve
A steep drop-off curve indicates that the pump is susceptible to cavitation at low flow rates. This type of pump requires a high NPSH to operate efficiently.
Tips for Pump Curve Analysis
Here are some tips for analyzing pump curves:
- Always use the pump curve provided by the manufacturer for accurate performance evaluation.
- Consider the system’s friction losses when determining the system curve.
- Ensure that the pump operates at or near its best efficiency point (BEP) to minimize energy consumption and operating costs.
- Avoid operating the pump at low flow rates as it can cause excessive wear and tear on the impeller and reduce the pump’s efficiency.
- Ensure that the required NPSH is available at the pump’s suction to prevent cavitation.
Selecting the Pump
When selecting a pump, the following factors should be considered:
- Flow rate requirement
- Head requirement
- Operating range
- Fluid properties (viscosity, density, temperature, etc.)
- NPSH available
- Efficiency requirement
By plotting the system curve (the relationship between the flow rate and head required by the system) on the pump curve, the operating point can be determined. The pump selected should operate at or near the BEP for maximum efficiency and longevity.
Optimizing Pump Performance
To optimize the pump’s performance, the following factors should be considered:
- Operating at or near the BEP for maximum efficiency
- Adjusting the impeller diameter or speed to match the system requirements
- Minimizing fluid friction and turbulence by reducing pipe diameter, increasing pipe roughness, or reducing fluid velocity
- Maintaining the pump and system to prevent wear and damage
Conclusion
In summary, understanding pump curves is essential in selecting the right pump for an application and optimizing its performance. A pump curve is a graphical representation of a centrifugal pump’s performance characteristics, which includes flow rate, head, and power consumption. By interpreting the pump curve, the operating point can be determined, and the pump selected can operate at or near the BEP for maximum efficiency and longevity.
FAQs
- What is the Best Efficiency Point (BEP) of a centrifugal pump?
The Best Efficiency Point (BEP) is the point on the pump curve where the pump operates at maximum efficiency. It is the point where the pump consumes the least amount of energy while producing the desired flow rate and head.
- What is the operating range of a centrifugal pump?
The operating range is the range of flow rates and heads over which the pump can operate without damaging the impeller or motor.
- What is the Net Positive Suction Head (NPSH)?
The Net Positive Suction Head (NPSH) is the difference between the fluid’s pressure at the pump suction and the vapor pressure of the fluid.
- How can pump performance be optimized?
Pump performance can be optimized by operating at or near the BEP for maximum efficiency, adjusting the impeller diameter or speed to match the system requirements, minimizing fluid friction and turbulence, and maintaining the pump and system.
- Why is understanding pump curves important?
Understanding pump curves is essential in selecting the right pump for an application and optimizing its performance, which can lead to cost savings and improved efficiency.
- How can I use pump curves for pump maintenance?
Pump curves can be used for pump maintenance by regularly monitoring the flow rate and head of the pump, plotting the operating point on the pump curve to determine the efficiency of the pump, adjusting the pump speed or impeller diameter to maintain the pump’s efficiency, and inspecting the pump for damage or wear and replacing any damaged components.
Recent Posts

Chemical Compatibility Guide: Pump Materials for Common Industrial Chemicals
Picking the wrong pump material

Chemical Pump Troubleshooting: Diagnosing Common Failures
Chemical pumps work hard. They

Mechanical Seals for Chemical Pumps: Types & Selection Guide
A mechanical seal is the